Bioreactors - The heartbeat of Biopharmaceutical Manufacturing For many biopharmaceutical manufacturing companies, the bioreactor is…

Connecting the dots with Process Flow Diagrams
As an engineer, it’s important to be able to explain complex concepts to others within your team, as well as those outside of your immediate team. Any activity that you perform as an engineer will require interacting with many different departments. These departments include Validation, Maintenance, Safety, Warehouse, and Safety.
It’s important that everyone is on the same page when working together towards a common goal. A Process Flow Diagram (PFD) is a useful and simple way to clearly capture even the most complex processes in a visual way that anyone can understand.
What is a Process Flow Diagram?
A Process Flow Diagram or PFD is a collection of symbols and arrows arranged in a sequence from start to finish.
The symbols refer to different types of equipment.
The arrows tell you where to start and where to end.
The order in which the equipment symbols are arranged should match the flow of the actual process in real life.
What is the purpose of a Process Flow Diagram?
A PFD shows how different types of equipment are connected to each other. The purpose of a PFD is to represent the overall equipment sequence in a visual way. A PFD does not focus on specific details of an individual piece of equipment.
Tools to create Process Flow Diagrams
There are many tools out there that you can use to easily create Process Flow Diagrams. A few of my favorites include:
- Microsoft PowerPoint
- Google Drawings
- Concept Draw
- AspenTech
- Engineering Toolbox – Online Drawing Tool
Best Practices when creating Process Flow Diagrams
- Use a title.
Let your reader know exactly what they’re looking at with a clear and prominent title. Typically, this information is included on the lower right corner of the PFD. - Tell the reader who prepared the diagram and when.
This is important if you ever want to make changes to the PFD later on. This information is also included in the lower right corner of the PFD. - Use a date.
This lets the reader know right away how old the drawing is. - Use labels.
Don’t let the reader guess what each component means in your PFD. - Use color.
Color helps you distinguish between groups of similar types of equipment. Just don’t go overboard with it or else you risk confusing your reader. - Draw from left to right.
Most people read from left to right. So should your PFD.
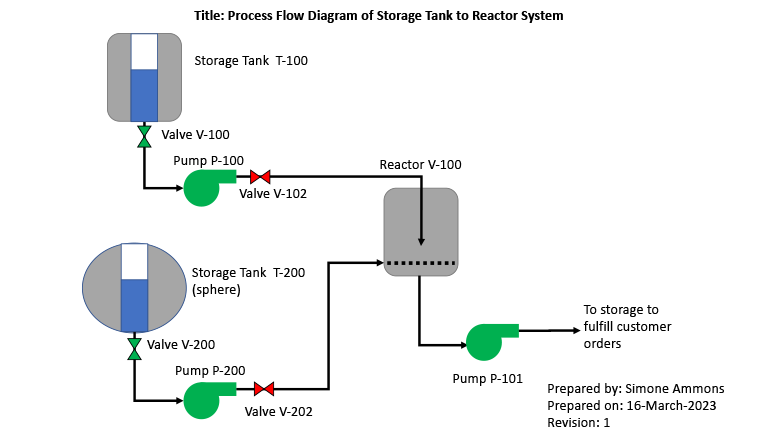
Example of a Process Flow Diagram
The PFD below was created using Microsoft PowerPoint. You can see that all of the best practices listed above were incorporated into making this PFD.
Be sure to keep these tips in mind when you create your next Process Flow Diagram.
For help in getting access to all the data associated with your equipment at your fingertips, request a demo with us today.
Give your data a QuneUp™!
Related Posts